
The Today dashboard and reports
Read the Today dashboard every morning, and use Reports to see close rates, lead sources, lead times, remakes and job margins.
SlabBoard gives you two views of how the shop is doing. The Today dashboard is what you see when you sign in: what's happening today and what's stuck. Reports looks back over a date range: who's selling, which lead sources pay off, how long jobs take and what you keep on each job.
The Today dashboard
Everyone on your team sees Today when they sign in. Click the SlabBoard logo to get back to it.
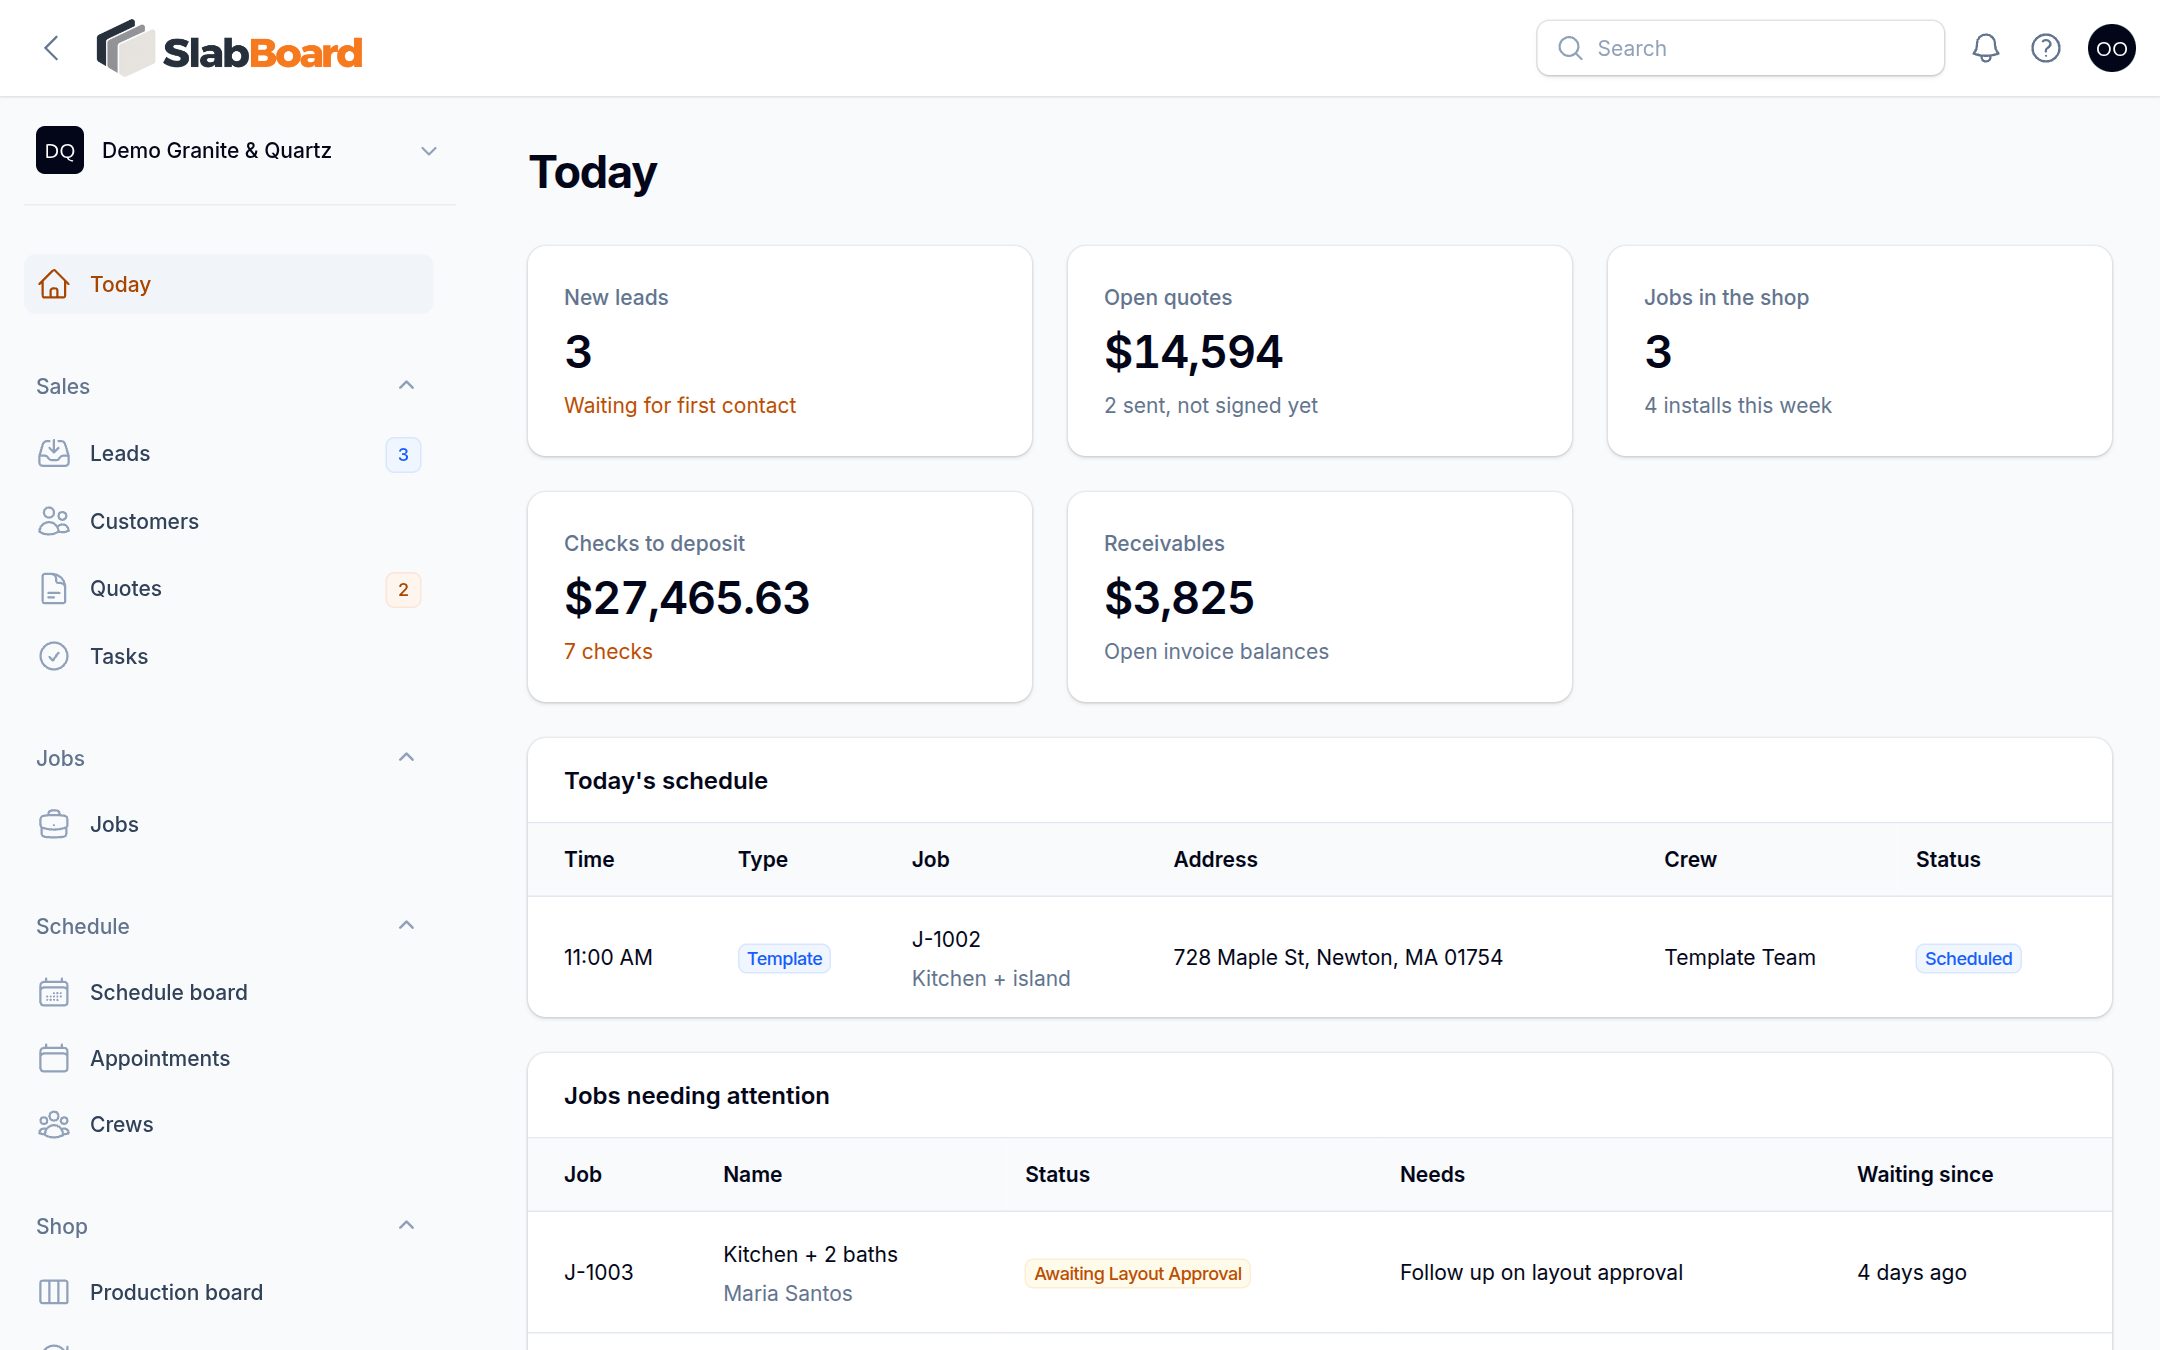
The numbers at the top
| Number | What it counts |
|---|---|
| New leads | Leads waiting for first contact. |
| Open quotes | The value of quotes sent but not signed yet, and how many there are. |
| Jobs in the shop | Open jobs, and how many installs are scheduled this week. |
| Checks to deposit | Checks received but not deposited yet, and how many have been sitting more than 3 days. |
| Receivables | What customers still owe on sent and partly paid invoices. |
Good to know: Receivables doesn't count draft invoices. A deposit invoice counts once you send it.
Templaters, installers and fabricators only see Jobs in the shop, unless you turn on Show job prices to the field crew in Company settings.
Today's schedule
Today's schedule lists today's appointments (templates, installs, deliveries and other visits) with the time, job and crew. "Today" follows the timezone in Company settings.
Jobs needing attention
This list shows jobs that are stuck, with what each one needs:
| Shows up when | Needs |
|---|---|
| Sold 2+ days ago with no template visit scheduled | Schedule template |
| Waiting on layout approval for 3+ days | Follow up on layout approval |
| Ready for install with no install scheduled | Schedule install |
| Installed 2+ days ago and not closed out | Close out: punch list & final payment |
Click a row to open the job. When nothing is stuck, you see Nothing stuck — nice work.
Sold per month
The Sold per month chart shows the contract amount of jobs sold in each of the last 12 months, leaving out cancelled jobs. People who can't see prices don't see it.
Reports
Reports → Reports needs the Premium plan and the Owner or Admin role.
Pick a date range
- Go to Reports → Reports.
- Set From and To. The report starts on January 1 of this year through today, and updates as soon as you change a date.
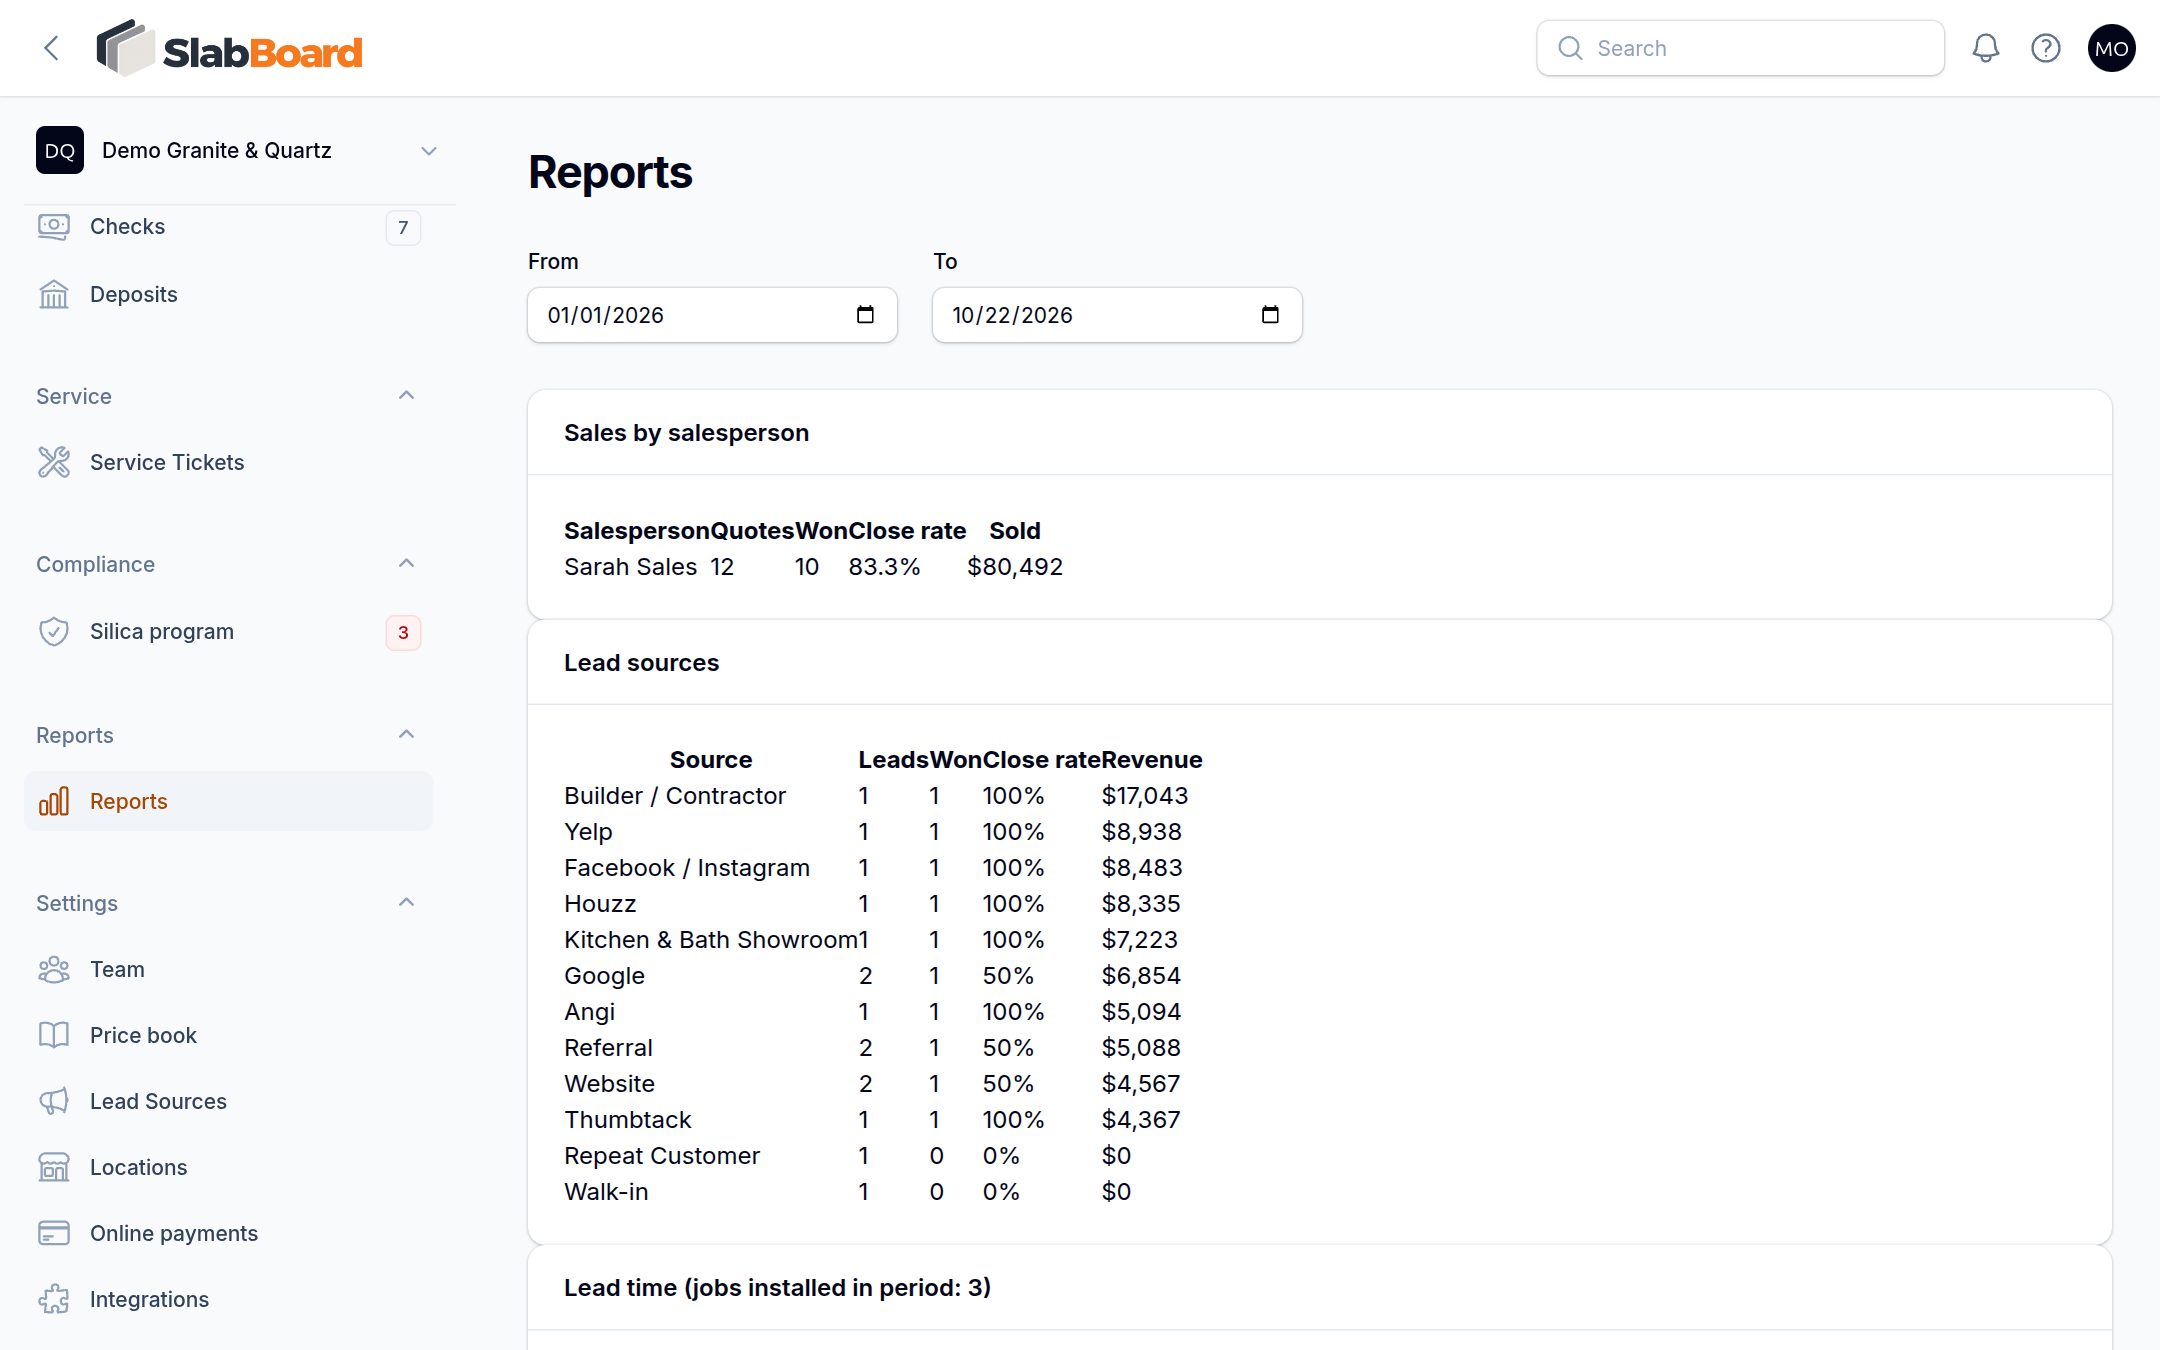
What's in the report
- Sales by salesperson: quotes created in the period (not counting drafts), how many were won, the close rate and the amount sold, for each salesperson. Quotes with no salesperson show as Unassigned.
- Lead sources: leads created in the period by source, how many were won, the close rate and the revenue from their jobs. This tells you which advertising pays off.
- Lead time: for jobs installed in the period, the average days Sold → template, Template → install and Sold → install.
- Remakes by reason: how many remakes and what they cost, by reason.
- Estimated job margin: for jobs sold in the period (up to 100, not counting cancelled jobs), contract plus approved change orders, minus material and remakes.
Important: The job margin is an estimate. Material is sq ft × the material's Cost / sq ft plus 20% waste. Labor and overhead aren't included. Enter costs on your materials to get useful numbers. See Price book and materials.
Tip: For the lead source report to work, pick a Source on every lead. See Leads.
Reports can't be exported or printed yet.
Related
Still stuck?
Write to us and a real person will answer. [email protected]